
We’ve all heard the news stories from friends on the left–the rich are getting richer, the poor are getting poorer. And we’ve heard the news stories from our friends on the right–interest rates are too high, but so is inflation. What does it all mean? And I don’t mean that rhetorically: what do all the big picture numbers mean to individuals and their money?
In this article I’ll take a stroll through some statistics on where individual consumers sit in terms of investments, savings, income, costs of living, and other data sets. Find yourself in the list, and see how you’re doing in 2023.

The Big Numbers
Most of our data is pulled from American statistics. If you’d like additional national data for context (UK, Australia, etc.), please let me know in the comments.
- Since last year, 49% of Americans have less savings than a year ago. [1]
- 24% have no savings at all. [2]
- 56% of Americans can’t afford a $1,000 emergency expense.
- A third can’t even afford a $400 expense. [3]
- 36% of Americans have more credit card debt than savings. [4]
- The average credit card debt is $8,942. [5]
- Over half of all Americans have delayed an important decision because they lack the money for it; that number has gone up over 20% in fifteen years. [6]
- 37% of American adults have reported that they’re “just getting by.” [7]
- Meanwhile, the “average” household in America earns $84,352 before taxes. The average budget breaks down like this:
- A third to rent/mortgate.
- The next highest category is transportation, at 17%;
- 12.5% on food–two-thirds of that on groceries, the rest on dining out.
- Insurance of various types account for 11.3%.
- And even after insurance, Americans spend about 8% of their budget on healthcare. [8]
Some very recent survey data give us insight into how Americans are thinking and feeling about their finances, more than just the day-to-day figures might.
- 24% of Americans say they had a better 2022 than 2021.
- But over half of Americans say they have trouble paying bills.
Investments

One key indicator of a person’s finances is their investments. This can be anything from stocks to property. It can give insight into the individuals that make up a national and global economy to understand how well-invested they are, what they’re invested in, and how those investments are performing.
- 58% of adult in the US are invested in stocks in some way. [9]
- These numbers, though, include individual stocks, retirement accounts, and other forms of investment.
- 89% of Americans earning $100,000 or more own stocks.
- That number falls to 25% of households earning less than $40,000.
- 79% of people with postgraduate degrees own stocks.
- Stock ownership by age bracket:
- 41% of 18-29 year olds.
- 62% of 20-49 year olds.
- 67% of people between 50 and 64 own stocks, the largest group.
- And only 59% of people over 65 own any stocks.
- Among the wealthy (at least $3 Million in assets): [10]
- Only 25% of Americans under 42 hold their assets in stocks,
- While 43 years old and up keep 55% of their wealth in the market.
- 65.5% of Americans own their homes; [11]
- This ranges from the high demographic of white Americans at 72.7% to a low demographic of 44% of black Americans.
- The median value of those homes, representing the investment return, is $440,300.
Debt
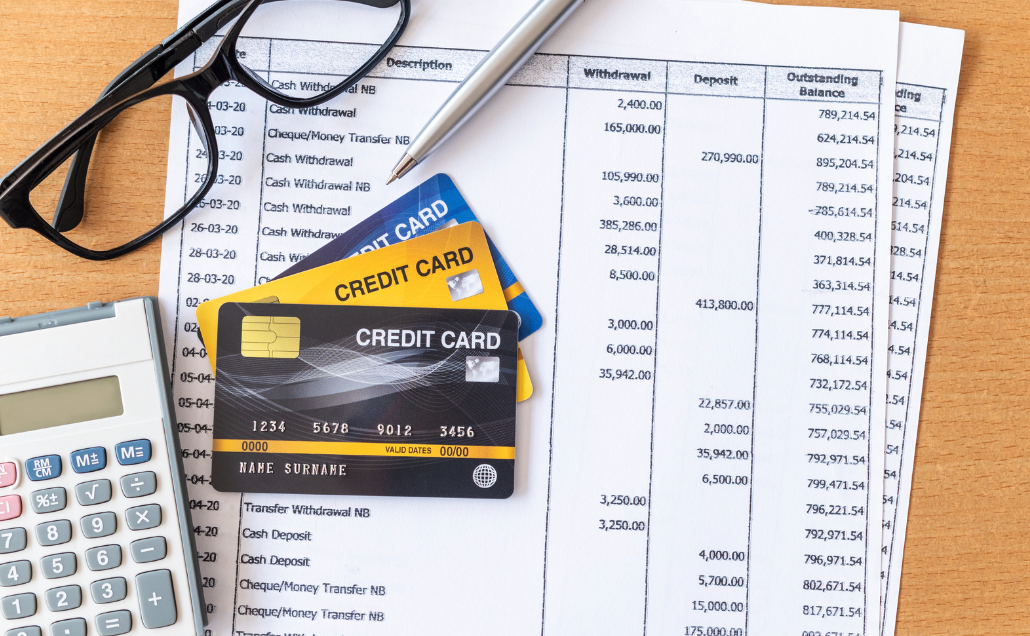
Debt takes into account home loans, credit cards, and more. And the amount and type of our debt can determine those very outcomes. Here’s a snapshot of some of our American’s debt trends.
Home Loans and Mortgages
- The average mortgage payment in the US is $1,427; the median is as low as $1,001. [12]
- For comparison, the average in the UK is £759 [13], and Australia hits the highest among the three, ranging from $2,328 for a mortgage in Northern Territory to a whopping $4,138 in NSW [14].
- 40% of homeowners in the US say they have trouble making their note. [15]
Credit Cards
- Americans owe over $800 Billion in credit card debt.
- That pencils out to the abovementioned roughly $9,000 per person.
- That’s dramatically higher than the UK, with only £201.9 Billion total, or £2,000 per person.
- Australia has an even lower total, at only $17 Billion, but that comes to about $2,907 per person.
- 60% of all Americans over 18 have at least one credit card.
- 23% of adults between 18 and 29 have credit cards that are over 90 days past due.
- 83% of all adults have a credit card;
- 92% of Asian-Americans have a credit card.
- 87% of whites.
- 76% of Hispanics, and
- Only 72% of African-Americans.
- 40% of US adults use a credit card to pay for everyday items.
Credit Score and Purchasing Power
There are many metrics that go into a person’s purchasing power when it comes to buying a car, a home, or securing financing for a business venture. Here are some stats that help shape the ability of individuals in the US to engage in higher finance.
- The average US credit score is at an all-time high of 714.
- Student loans are holding many Americans back, when it comes to credit, with the national student loan debt standing at a staggering $1.6 Trillion.
- That is comprised of over 46 million people paying student debt.
- The higher degree a person has the more likely they can pay their loans.
- Less than an Associate’s degree: 31% delinquent.
- Associates: 22% delinquent.
- Bachelors: 9%, and,
- Masters or higher have a low 8% delinquency rate.
- The higher degree a person has the more likely they can pay their loans.
Savings

The Federal Reserve in the US takes survey data periodically, and unfortunately the most recent numbers are from a couple of years ago. The raw numbers, though, are still important.
- The Average amount (or mean) in bank accounts is $41,600. But that includes the uber-rich.
- The Median, or exact middle number of all bank accounts had only $5,300.
- Taking all assets into account, including homes and other investments, the median worth of Americans is $121,760.
- The millionaires and billionaires drag the mean up to $746,820.
Other data from surveys tells a more nuanced story about how people are, and are not, saving money.
- Almost two-thirds of adults in the US live paycheck to paycheck, with no meaningful savings.
- That includes 36% of people earning $250,000 or more.
- But perceptions often differ from reality. 75% of Americans think they’re doing “okay financially.” [16]
- Put that against other survey data that shows 83 million Americans struggle financially, or are in absolute crisis mode. [17]
- Paying rent, as many Americans do, holds them back from saving anything; 34% more renters in 2022 said they struggled to pay rent. [18]
- That has increased the number of renters having trouble to 63%. [19]
Having already discussed debt, and now having covered some savings statistics, we can look at the two data sets in tandem:
- 38% of people 18-26 have more credit card debt than savings.
- That number climbs to 45% for people 27-42;
- 44% for people 43-58;
- But falls to only 25% of people over 59 who have more credit card debt than savings. [20]
Retirement
A subset of savings is that which people set aside for retirement. In many cases, according to the data, Americans could be doing much better.
- 56% of people say they’ll have less than $500,000 for retirement.
- Put that against the current cost of living at $38,266 for a single person, and that means people expect only around 12 years worth of retirement saved up.
- Only 22% of people about to retire say they have enough money for it.
- That could be because only 23% have a written retirement plan;
- Or because 37% have not planned at all.
- And among people already retired, 44% say that their expenses are higher than they’d thought [21].
Financial Literacy

Financial literacy encompasses everything from being able to understand home loan paperwork to being able to set a weekly budget. More and more, researchers are noting that financial literacy is a strong indicator of personal finances.
- Financial literacy, or being able to understand how their money works, has cost 11% of adults more than $10,000.
- 38% of people said financial literacy had cost them at least $500.
- The average cost of not understanding finances? $1,819 per year.
- According to recent findings on a Financial Literacy Quiz:
- 53% of people who score above the median spend less than they make, and 65% of them had a three-months savings [22].
- 25% of Americans say they don’t have anyone to talk to about finances [23].
- Only 32% of Americans have a written budget [24].
- Ironically, those making over $75,000 are more likely to have a budget.
- The average American spends less than 5 hours per year on their budget or finances.
- 86% of Americans think financial literacy should be taught in school, but;
- Only 17% of high schoolers do [25].
Odds and Ends
Some financial statistics don’t fit neatly into a box. Here are some nuggets that are interesting, and add context to the above data.
- 41% of Americans say that financial trouble actually make them lose sleep.
- Recent medical data show a direct link between financial success and health outcomes [26].
- Globally, something as simple as a 1% increase in ATMS can lead to a 0.134% increase in life expectancy [27].
References
To read our privacy policy click on this page.