Key Takeaways
- Three-step process for trading: identify the trend, conduct technical analysis, confirm entry point.
- Set a stop-loss based on the Average True Range (ATR).
- Set a take-profit order based on the resistance levels.
- Calculate risk and profit percentages, as well as profit to risk ratio, to determine whether it is a worthwhile trade.
- Never trade more than you can afford to lose.
You have made it to the final lesson in the crypto trading course for beginners, and I hope you have found the course informative. Now it's time to combine everything we have learnt and actually start trading.
If you haven't signed up to a crypto exchange yet, I suggest you sign up to MEXC Global. I will be using screenshots from my MEXC account, so it will be easier for you to follow along. Also, you can claim $30 USDT and 10% discount on trading fees when you use this link! If you become a large trader, you can even claim up to $9,100 in bonuses!
Three-Step Process
Every time you make a trade, it's important to follow what I call the Three-Step Process. This ensures that you are not focusing on just one particular pattern to make your trade, but rather using various tools and indicators to make an informed decision. These are the three steps:
1. Identify the trend
Which way is the market trending? Scroll out on the graph so you can see more than just the last few days. Ask yourself, is it an uptrend, a downtrend, or sideways trend (consolidation)? As a beginner trader, you want to follow the trend, as it is the safest option.
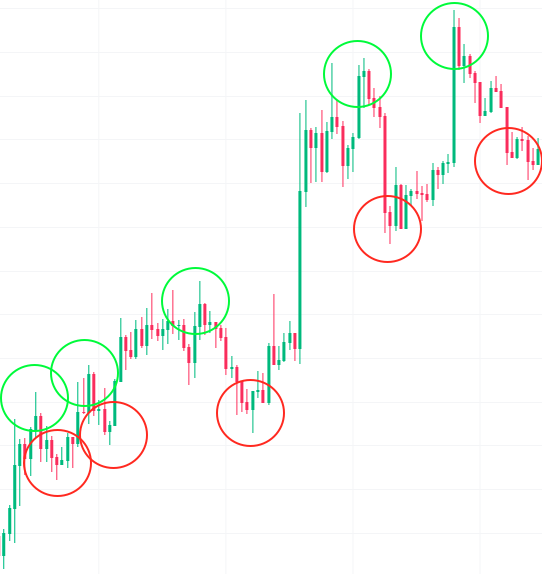
Remember what to look for when identifying the trend. For example, higher peaks and higher troughs (like in the example below) are signs of an uptrend.
2. Use technical analysis to see where to enter trade
This is where we identify support and resistance areas, and look for price zones that we can enter a trade. Also keep a lookout for chart patterns that are emerging, which can identify good spots for a breakout.
3. Confirm entry point
The final step is to use the candlestick charts to time our entry point. Study the recent candlesticks, and check that any patterns are confirming your trade (whether it is bullish or bearish). If so, you are good to enter the trade.
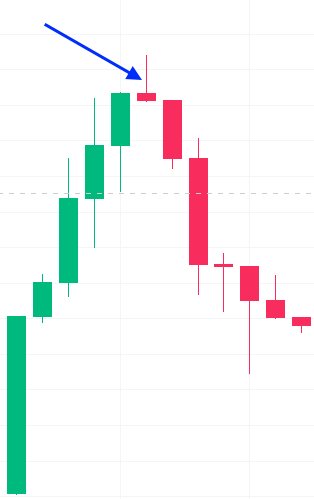
On the other hand, if there is any pattern that is contrary to what you are looking for, don't enter the trade. For example, let's say the trend is bullish, and you are looking to buy a cryptocurrency to profit from a price increase. If you look at the most recent candlestick, and you see a shooting star pattern, you shouldn't enter the trade, since that is a bearish signal.
Swing Trading
You may remember we covered swing trading in lesson 6, and we will be using this strategy in this lesson. To remind you, swing trading is a short-medium term trading strategy, with trades that open for days to weeks. It relies on technical analysis, and has potential for short-term profits. The downsides are that you may miss out on longer term trends and profits, and if there are any large short-term swings, you can be closed out of your trades, due to stop-losses.
Trading Example
Let's go through an example with a BTC/USDT graph below.
1. Identify the trend
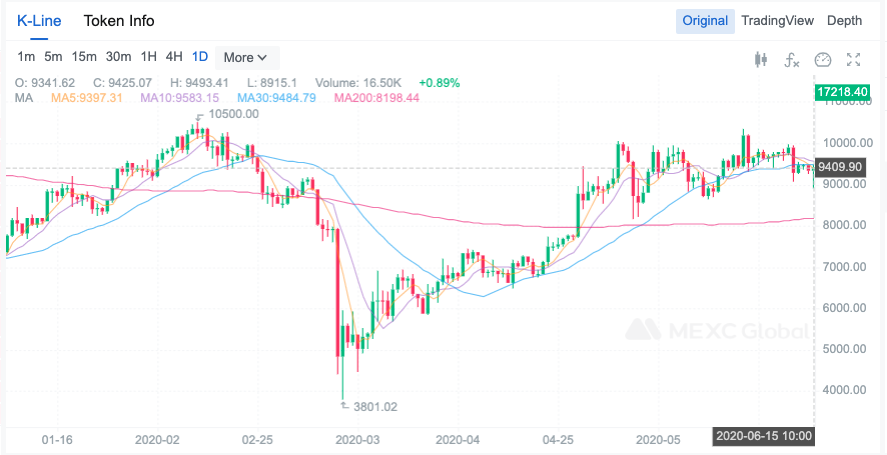
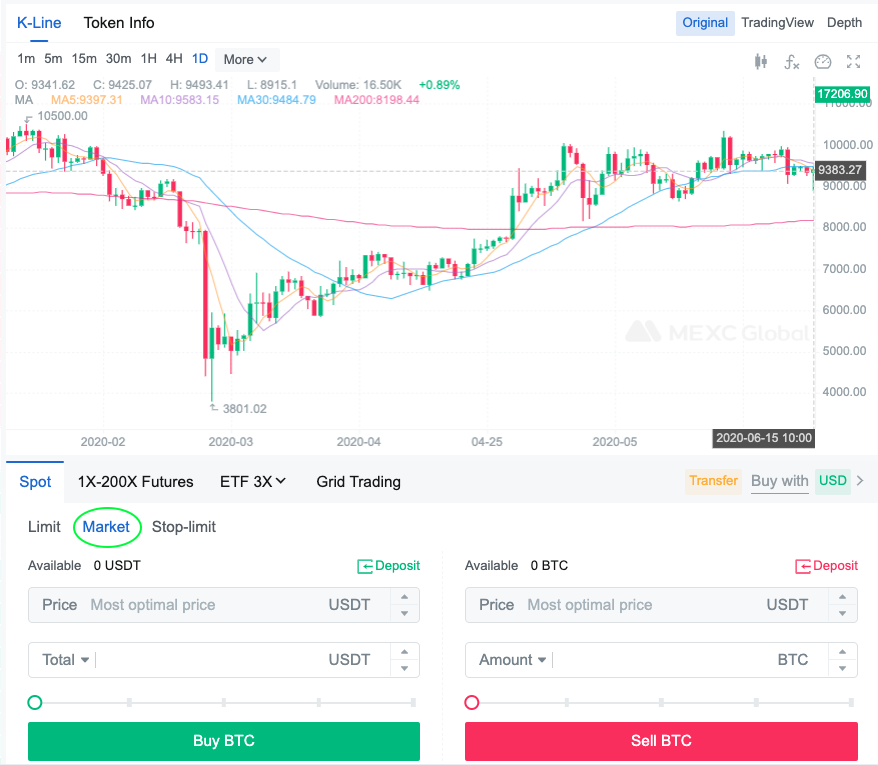
We are looking at a chart with a 1 day candlestick, which means each of those candles represents a 24-hour period. We can see from the chart, that since the big dip, in March 2020, there has been a steady uptrend until 15th June 2020. It is clear that the highs are getting higher, and the lows are also getting higher, both signs of a bullish trend. You also see the pink line, which is the 200-day simple moving average on the chart. Since late April 2020 until mid-June 2020, the price of BTC is above the 200-day SMA, another sign of an upwards trend.
2. Technical analysis
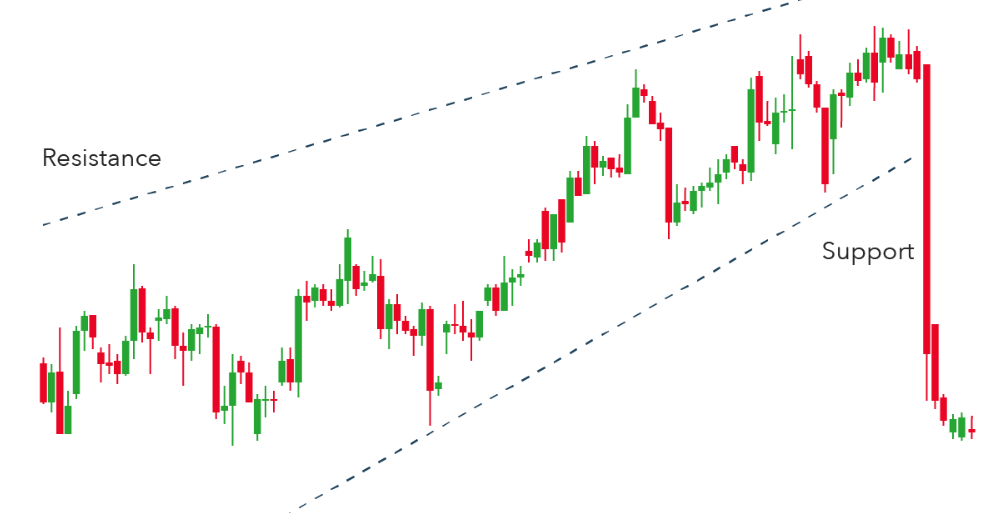
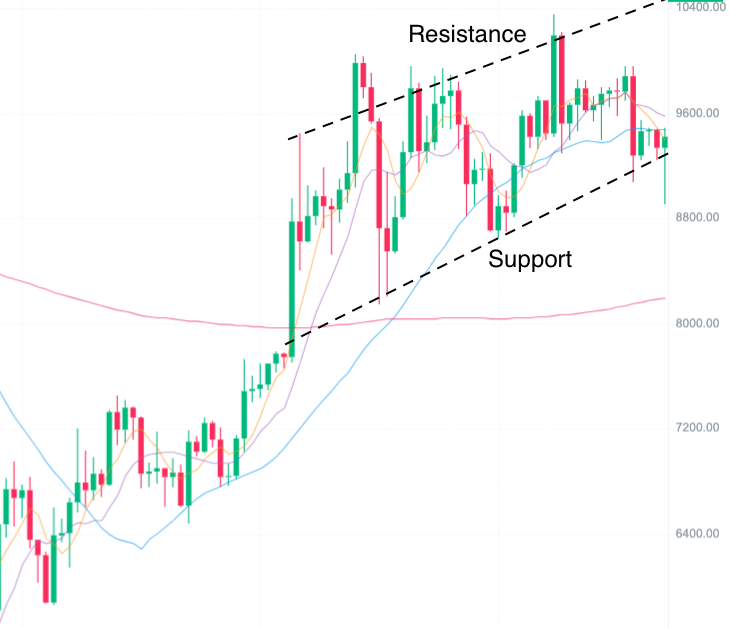
Now we can conduct some technical analysis on the chart. I have drawn a support line in the screenshot below; you can see the support line has been tested several times and the price has bounced back up each time. At the top of the graph I have drawn in the resistance, which has been tested several times, and the price has not managed to go much higher than those levels.
Both resistance and support are sloping upwards, which is a rising wedge chart pattern, which we learned from lesson 7. This is a bullish trend, which confirms what we found from step 1.
We want to enter the trade near the support, as it means the price should rise up to near the resistance before falling back down to the support. If this happens, we make an easy short-term profit. Since the last candlestick is at the support line, now appears to be a good time to enter the trade. But first, let's confirm this with step 3.
3. Confirm entry point
Looking at the last candlestick, we see a green (bullish) candle, with a short body, and a long lower wick. You may remember from lesson 7 that this is indicative of a hammer pattern. This is a strong bullish signal, and confirms our entry point. Let's make a purchase at the current price.
Underneath the graph, click on 'Market' (circled in green in the screenshot below). This means we will buy Bitcoin at the best available price. We want to do this in our example because the price is near the support line. (If the current price was above the support line, then we would instead place a limit order instead, with the 'buy price' at the level of support.) Next to 'Total', type in the amount of USDT you wish to spend on BTC. If you want to buy $1,000 of BTC, type in 1,000, then click the green 'Buy BTC' below.
Setting a stop-loss order
You will remember from earlier in the course that it is important to use a stop-loss. This means that you set a price level at which your crypto will automatically be sold, in order to prevent yourself losing more money than you intend. One of the best ways to determine at what price level to set a stop-loss, is to use the Average True Range (ATR) which we discussed in lesson 8.
To access this, we need to click on 'TradingView', then select 'Average True Range' from the indicators. To see screenshots on how to do this, click back to lesson 8.
In the screenshot below, you can see the ATR as a red line at the bottom of the chart. You can see that the ATR at the point which we want to buy (15th June 2020) is 411.2360. This means that the maximum that the price is likely to fluctuate in one day is 411.23. We will use this number to set our stop-loss. We don't want to set our stop loss too close to our purchase price, because if the price is expected to drop 411 in one day, we don't want to close our trade for no reason. Conversely, if we set our stop loss too far from our purchase price, then we can lose more money than we intended.
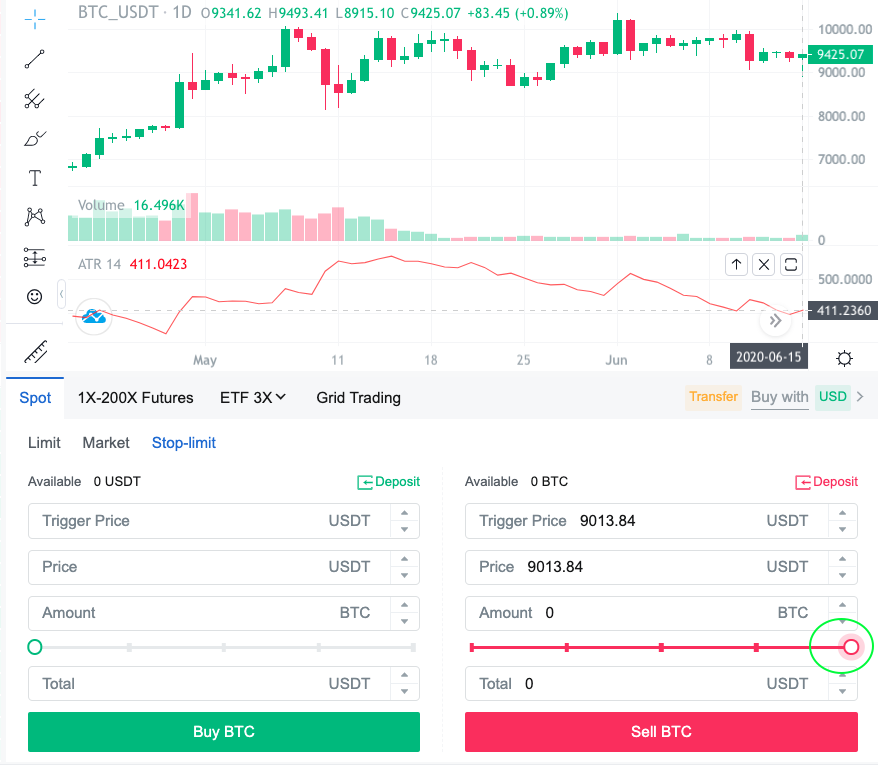
Say our current buy price is 9425.07. We subtract the ATR from the entry price to get our stop loss.
9425.07 - 411.23 = 9013.84
This means we will set our stop loss at 9013.84. If you look at the screenshot above, you can see how we input this. Click on 'Stop-limit', highlighted in blue below, then enter the details on the right hand side (the Sell BTC side). We have input the trigger price at 9013.84, and the sale price also at 9013.84. This means that if the price drops to 9013.84, we want to place a limit order to sell our BTC at 9013.84. Underneath, you can see a red slider (circled in green). Drag that all the way to the right to indicate that you wish to sell 100% of your BTC if the stop loss is triggered. When you are ready, click the red 'Sell BTC' button, which will create the stop loss order.
Setting a take-profit order
While setting a stop-loss is most important, setting a take-profit is also a good idea. A take-profit order means that when the cryptocurrency hits a certain price, it will automatically place a sell order. This means you lock in your profits before the price drops down again. While you may miss out on potentially larger gains, it is a safer way to lock in small short-term profits.
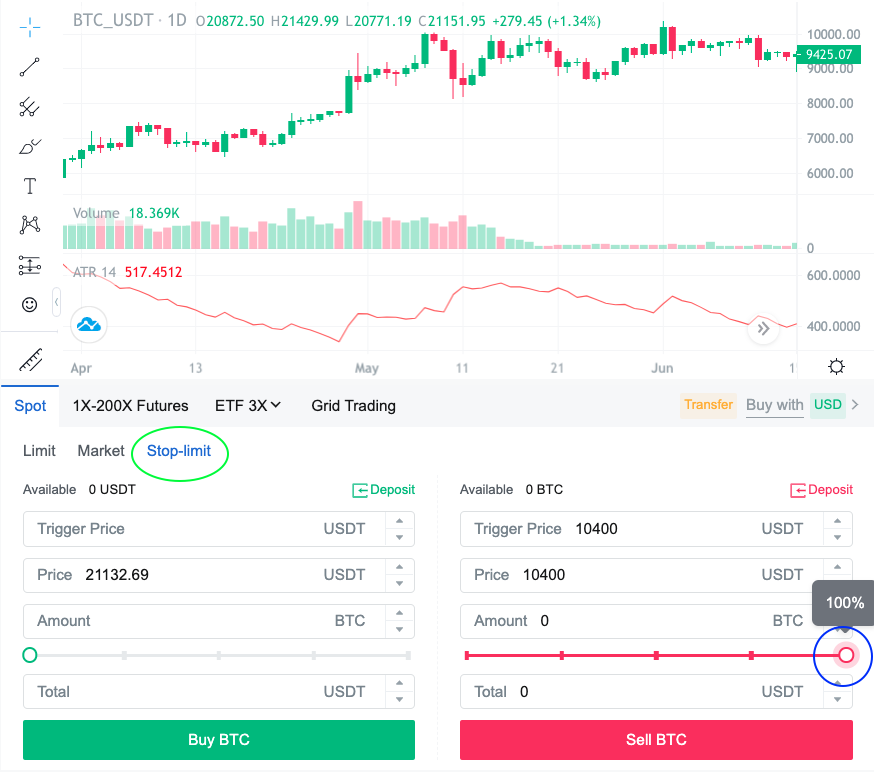
Where do you set your trigger price for a take-profit? We use our technical analysis from before, when we drew the resistance line on our graph (see image below). We can see that the resistance is around the 10,400 mark. This means that it is unlikely to break higher than that point before coming back down towards the support.
I'll show you how to create a take-profit order, using the price 10400. In your MEXC trading account, click on 'Stop-limit' (circled in green below). Then we will enter our information on the right side (the sell BTC side), since we will be placing a sell order in order to take profits. The trigger price will be 10,400, and the price is also 10,400. This means that if the price of BTC reaches 10,400, it will automatically place a limit order at 10,400. Underneath, you will see a red slider button, which you can click and drag all the way to the right (circled in blue below). This means you will sell 100% of your BTC when the price gets to 10,400. When you are ready, click the red 'Sell BTC' button, which will create the take-profit order.
Risk and profit calculations
Now we are going to calculate the risk, and compare it to your profit. This part may seem boring to those who don't like maths, but it is essential to understanding whether a potential trade is good or not.
RISK calculation
ATR ÷ Entry Price x 100 = Risk %
In our example above, let's input the numbers:
411.23 ÷ 9425.07 x 100 = 4.4%
What does 4.4% risk mean? This is the percentage of your investment that you can possibly lose, if the stop loss is triggered. For example, if you invested $100, you could lose $4.40.
It is up to you to choose a Risk percentage that you are happy with. If you are happy to risk a higher amount, for example 10%, you can increase the amount that the price can drop before you place the stop loss. On the other hand, if you don't want to risk too much, you can make the stop loss closer to the buy price.
PROFIT calculation
Take Profit ÷ Entry Price x 100 - 100 = Profit %
In our example above, let's input the numbers:
10,400 ÷ 9425.07 x 100 - 100 = 10.3%
What does 10.3% profit mean? This is the percentage of your investment that you can make, if the take-profit is triggered. For example, if you invested $100, you could make $10.30 profit.
If you want to make a higher profit, you can raise your take-profit price. But remember that if it is too high, you may not trigger that sale, and the price may drop back down.
Profit to Risk ratio
Profit % ÷ Risk % = Profit to Risk Ratio
In our example above:
10.3 ÷ 4.4 = 2.34
This is a great ratio, because it means that your potential gains are 2.34x your potential loss. Again it is up to you to decide what is a ratio that you are comfortable with, but I would suggest that any ratio of 2 or above is a good start for a beginning trader.
Final Words
Congratulations for making it through to the end of this cryptocurrency trading course for beginners! Hopefully you have found it useful, and can use it to make some money. Remember to always do your research and technical analysis before entering trades, and never trade more than you can afford to lose.
If you have any feedback, questions, or comments regarding this course, feel free to contact me here. You can also check out all the resources available on this website. Good luck, and happy trading!